HAPPY THANKSGIVING!
2020 Real Estate Outlook
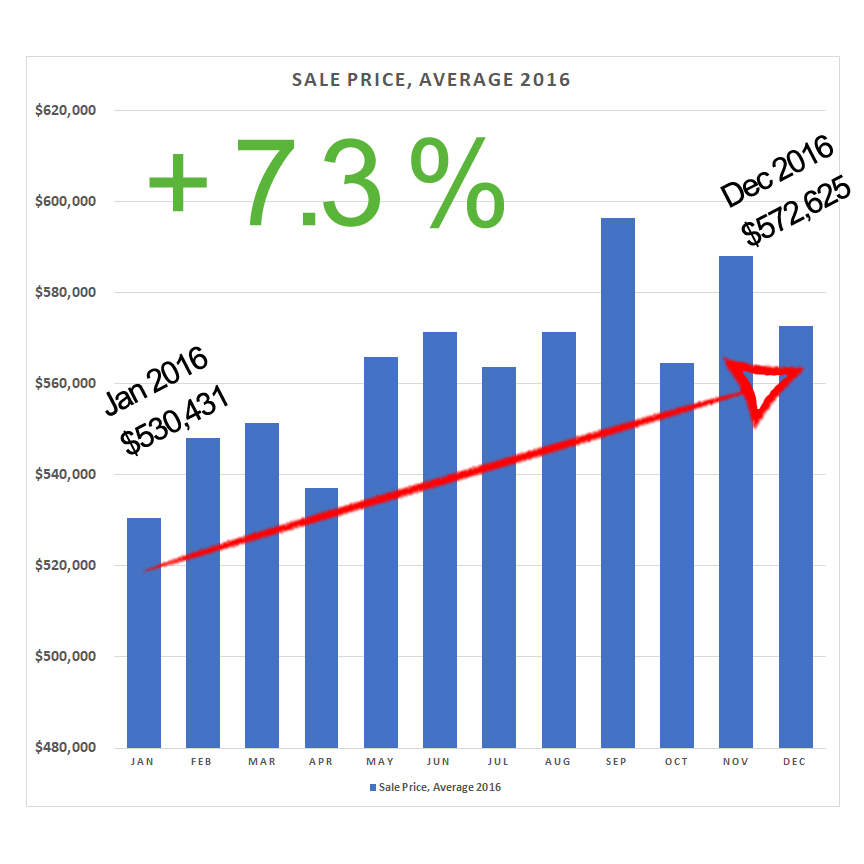
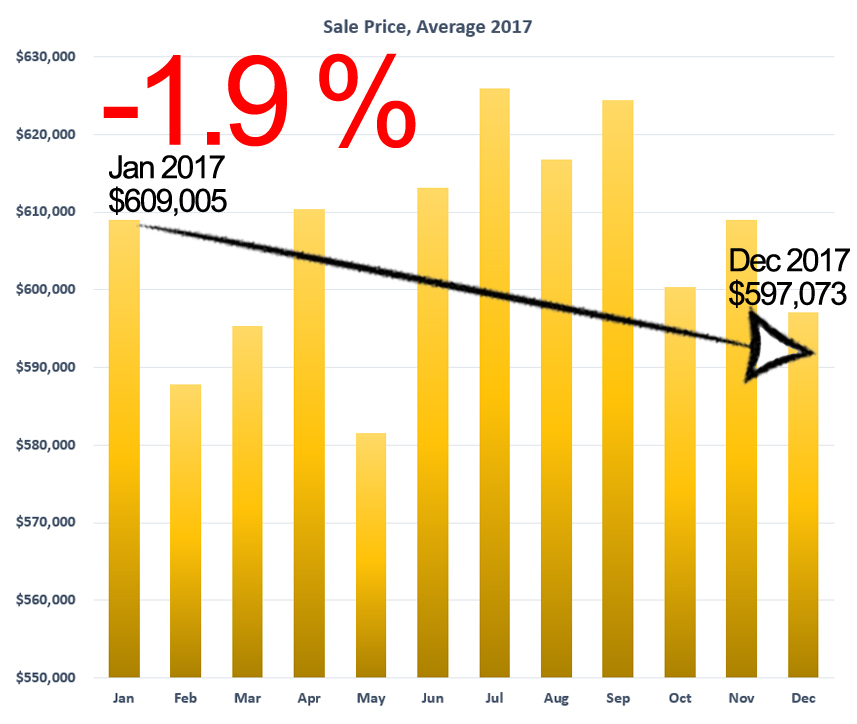
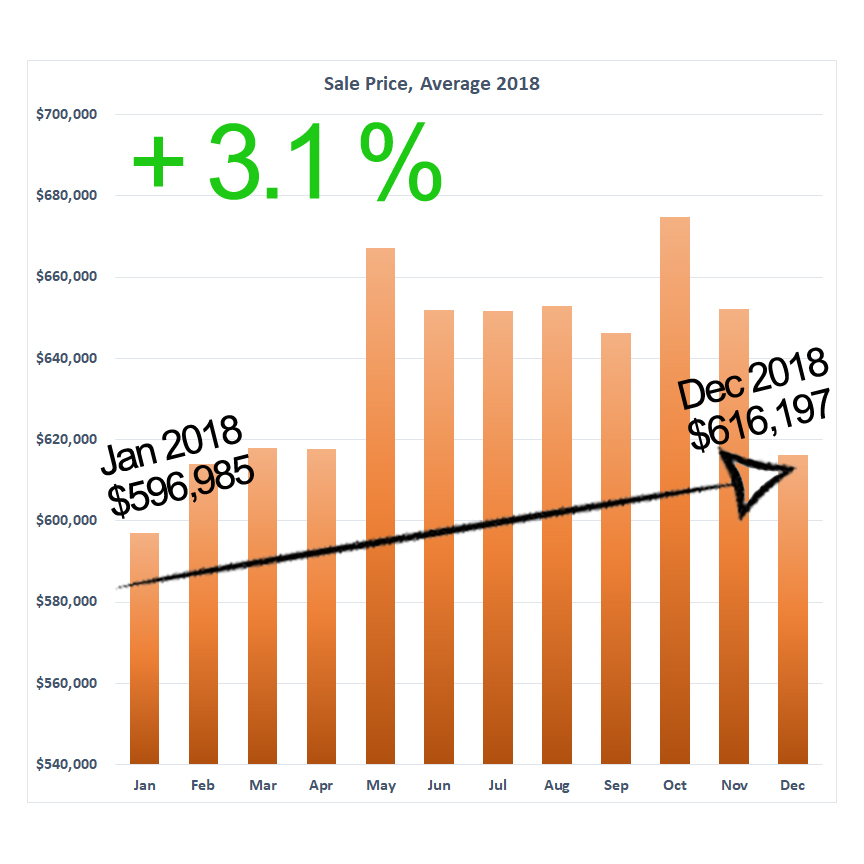
Everyone wants to know what will happen to real estate home values in 2020, especially since this is an election year. Here in LA and Orange County we’re so used to home values shooting upward year over year that if we don’t see a big rise in home values in one years’ time we tend to think that the real estate market is about to crash. As seen on the graph with the blue bars, 2016 showed us a +7.3% increase from Jan 2016 to Dec 2016. That may not seem like much to the average person but a +7.3% increase in home values is an astronomical increase in the world of real estate. 2017 Showed us a -1.9% decline just looking at the months of Jan and December as seen on the graph with the yellow bars. For the purposes of this data we are more interested in the year over year trend in home values. We’re not very concerned with the data from 2017 showing a -1.9% decline because January 2017 was such a strong month and December many times can be slightly slower because of it being an end of the year holiday month. The most important thing to note is that Dec of 2016 showed an average sales price of 572,625 while Dec of 2017 showed an average sales price of $597,073, almost a $30,000 increase. 2018 gave us a +3.1% increase which overall is a wonderful and HEALTHY increase in real estate home values.
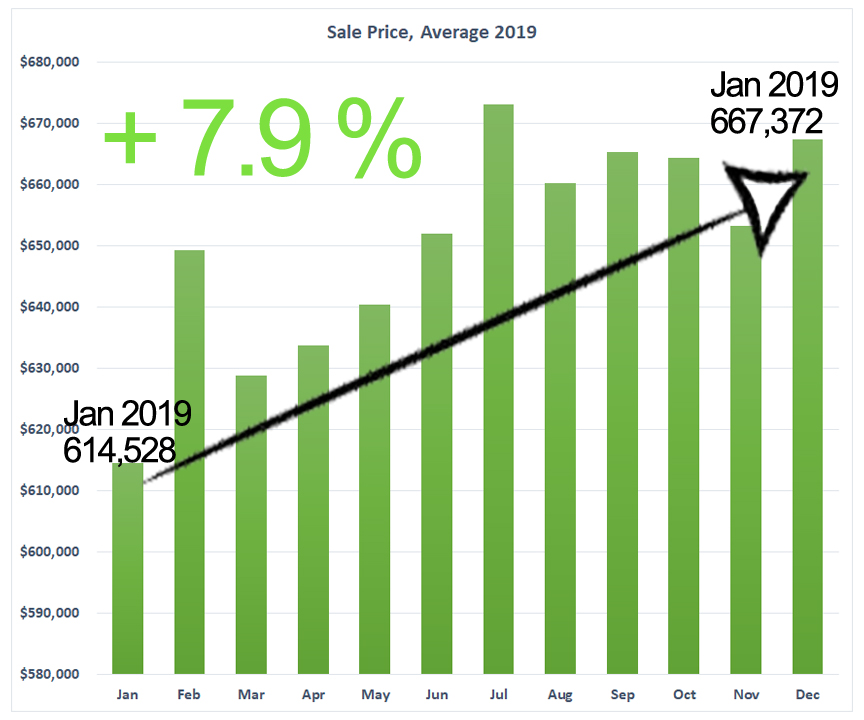
The most recent data seen on the graph with the green bars, shows a HUGE +7.9% increase in home values from January 2019 to Dec 2019. That is a very large jump in home values for 1 years’ time. We are looking forward to 2020. This is the time to get the most for your home. Remember, there is a point where values will not shoot as high as they have in recent years. Take advantage of the equity you have NOW!!!
2020 Real Estate Outlook
Everyone wants to know what will happen to real estate home values in 2020, especially since this is an election year. Here in LA and Orange County we’re so used to home values shooting upward year over year that if we don’t see a big rise in home values in one years’ time we tend to think that the real estate market is about to crash. As seen on the graph with the blue bars, 2016 showed us a +7.3% increase from Jan 2016 to Dec 2016. That may not seem like much to the average person but a +7.3% increase in home values is an astronomical increase in the world of real estate. 2017 Showed us a -1.9% decline just looking at the months of Jan and December as seen on the graph with the yellow bars. For the purposes of this data we are more interested in the year over year trend in home values. We’re not very concerned with the data from 2017 showing a -1.9% decline because January 2017 was such a strong month and December many times can be slightly slower because of it being an end of the year holiday month. The most important thing to note is that Dec of 2016 showed an average sales price of 572,625 while Dec of 2017 showed an average sales price of $597,073, almost a $30,000 increase. 2018 gave us a +3.1% increase which overall is a wonderful and HEALTHY increase in real estate home values.
The most recent data seen on the graph with the green bars, shows a HUGE +7.9% increase in home values from January 2019 to Dec 2019. That is a very large jump in home values for 1 years’ time. We are looking forward to 2020. This is the time to get the most for your home. Remember, there is a point where values will not shoot as high as they have in recent years. Take advantage of the equity you have NOW!!!